'Manager CPU usage very high' alarm is generated for NSX manager VIP node
Article ID: 393482
Updated On:
Products
Issue/Introduction
- Alarm similar to following is generated for NSX manager VIP node.
The CPU usage on Manager node <manager-uuid> has reached 97% which is at or above the very high threshold value of 95%. - Percentage of utilization in the alarm may vary.
- The alarm is only observed for NSX manager node running cluster VIP.
- Output of 'top' command shows uproxy process consuming CPU. For e.g.,
PID USER PR NI VIRT RES SHR S %CPU %MEM TIME+ TGID COMMAND84157 uproxy 20 0 2037652 602488 8 S 211.5 2.5 8465:19 84157 /usr/lib/jvm/openjdk-java8-runtime-amd64/bin/java -
Environment
VMware NSX
VMware NSX-T Data Center
Cause
High number of API calls to cluster VIP.
As the environment scales up overall traffic may have increased.
Resolution
To ensure optimal performance and avoid overloading the NSX Manager, it is important to monitor and manage the volume of API calls made to the NSX Manager VIP. If any external system is found making a high number of API requests, assess whether all such calls are necessary and reduce them if not.
By default, NSX Manager supports up to 100 API calls per second for each manager node.
This can be validated by analyzing the API access logs directly from the NSX Manager CLI.
1. NSX Version < 4.x
For NSX versions earlier than 4.x, the logs are located at:
Perform the following analysis by executing these commands on each NSX Manager node:
[Top API Requesters]
zgrep -Fh '/api/' /var/log/proxy/localhost_access_log.txt* 2> /dev/null | awk '{print $2}' | sort | uniq -c | sort -rn | head
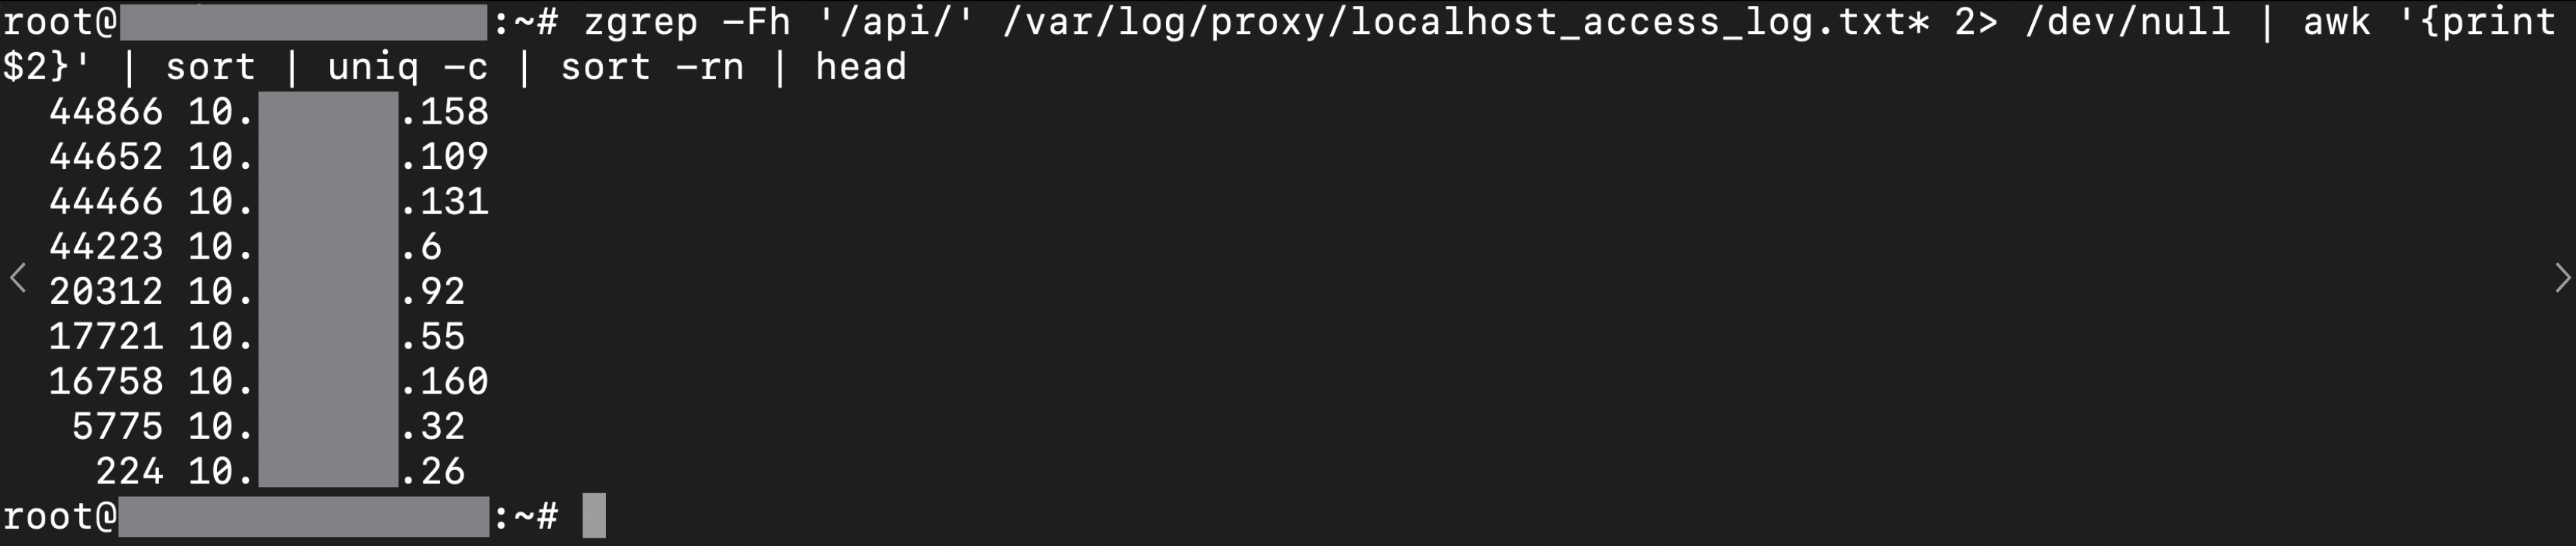
[Top Frequency (By IP)]
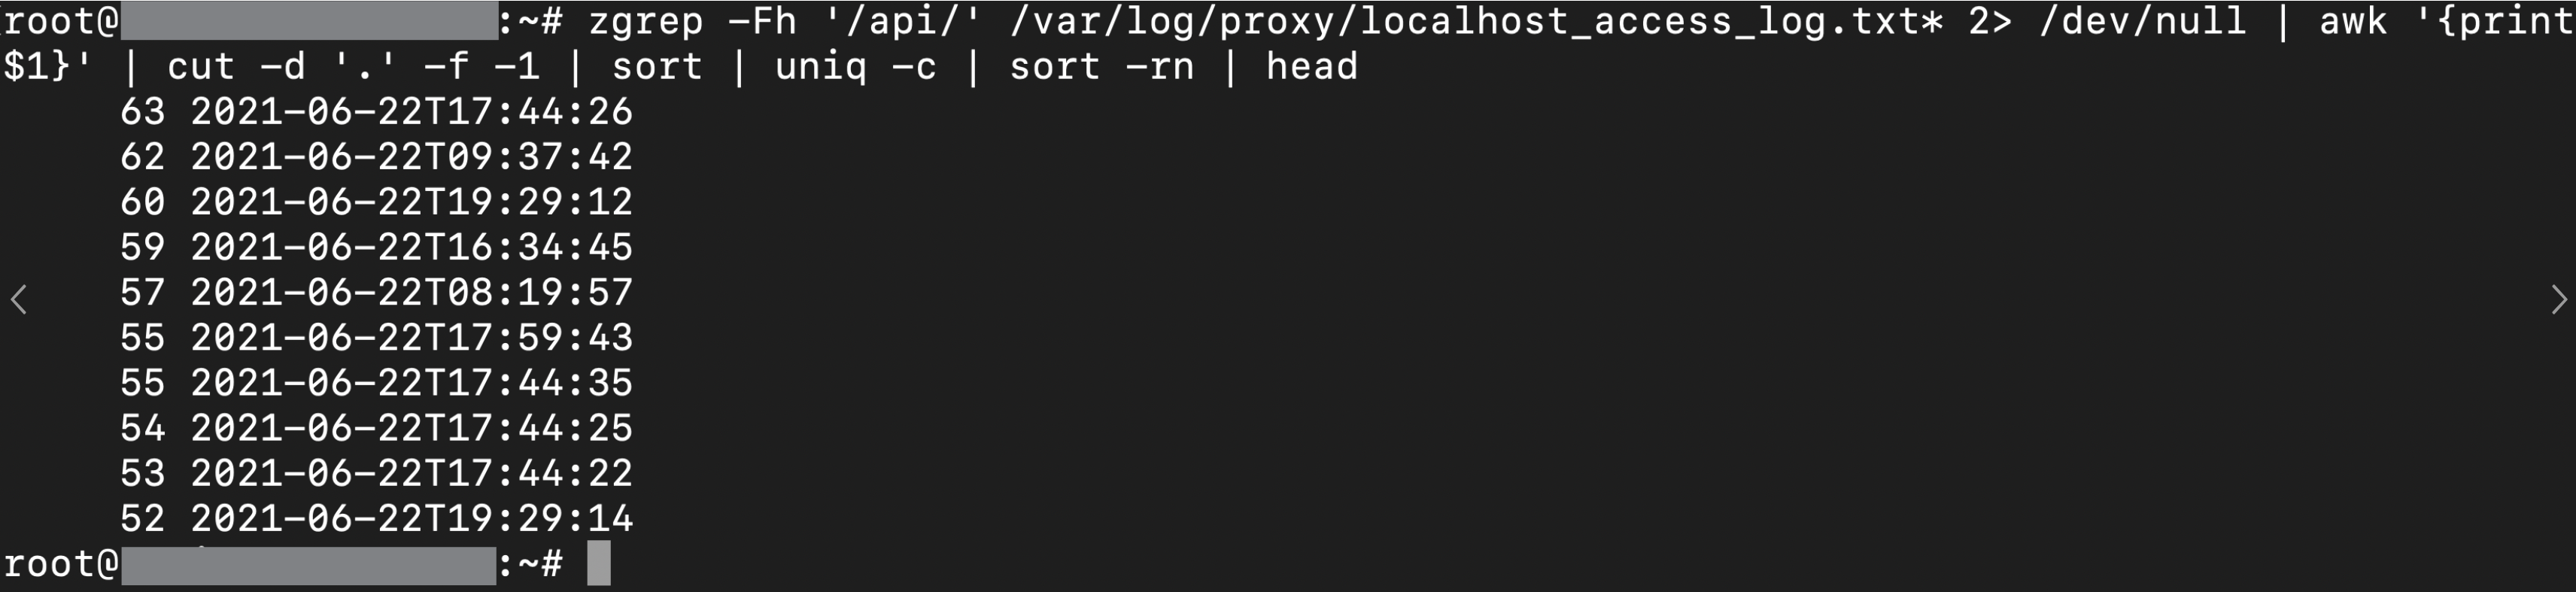
zgrep -Fh '/api/' /var/log/proxy/localhost_access_log.txt* 2> /dev/null | awk '{print $1}' | cut -d '.' -f -1 | sort | uniq -c | sort -rn | head
[API Requesters at Specific Timestamp]
Replace <TIMESTAMP> with the desired time (e.g., 2020-02-06T05:29:39):
zgrep "<TIMESTAMP>" /var/log/proxy/localhost_access_log.txt.* | awk '{print $2}' | sort | uniq -c | sort -rn | head[Top API Calls at Specific Timestamp]
2. NSX Version ≥ 4.x
For NSX 4.x and later, API access logs have been migrated to the following path:
Run the following commands on each NSX Manager node for analysis:
[Top API Requesters]
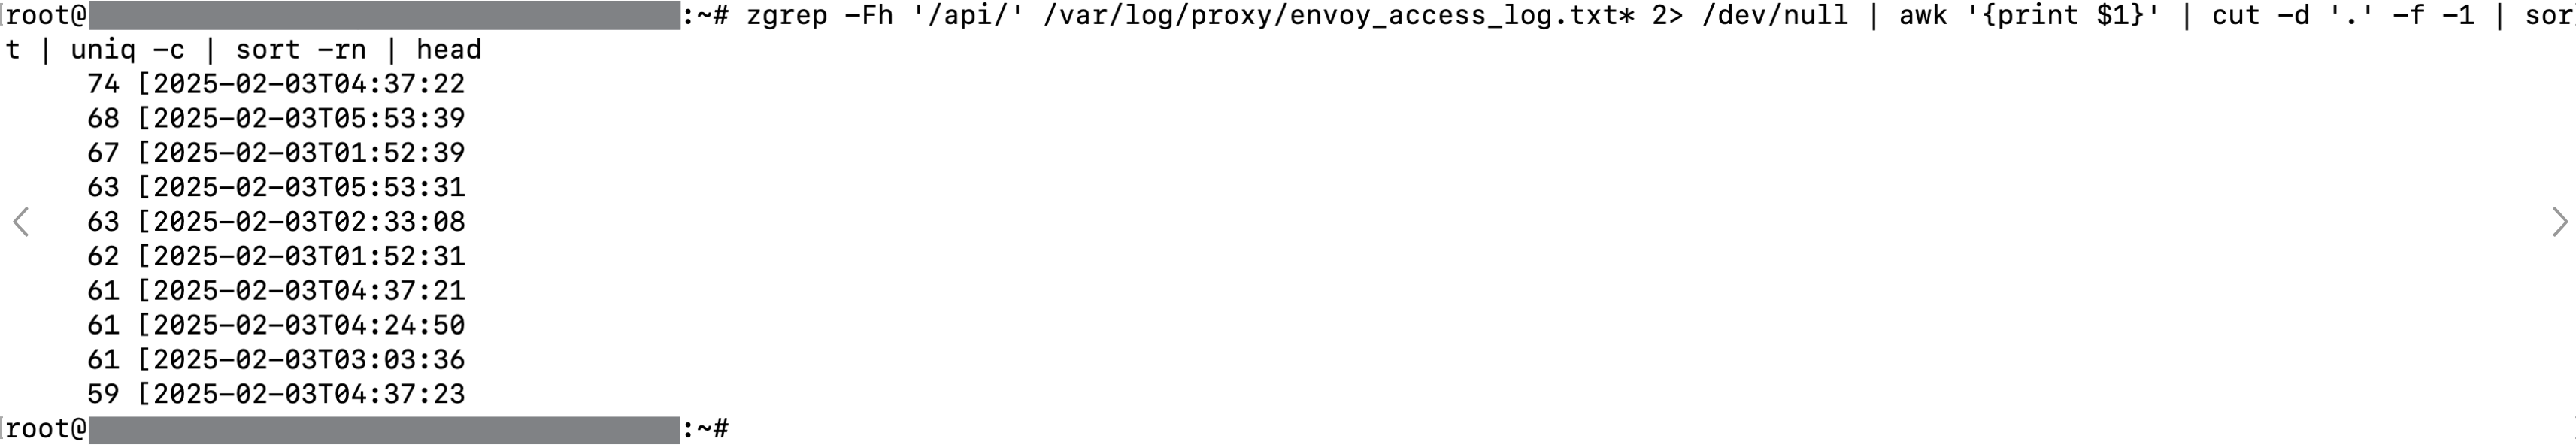
zgrep -Fh '/api/' /var/log/proxy/envoy_access_log.txt* 2> /dev/null | awk '{print $2}' | sort | uniq -c | sort -rn | head

[Top Frequency (By IP)]
zgrep -Fh '/api/' /var/log/proxy/envoy_access_log.txt* 2> /dev/null | awk '{print $1}' | cut -d '.' -f -1 | sort | uniq -c | sort -rn | head
[API Requesters at Specific Timestamp]
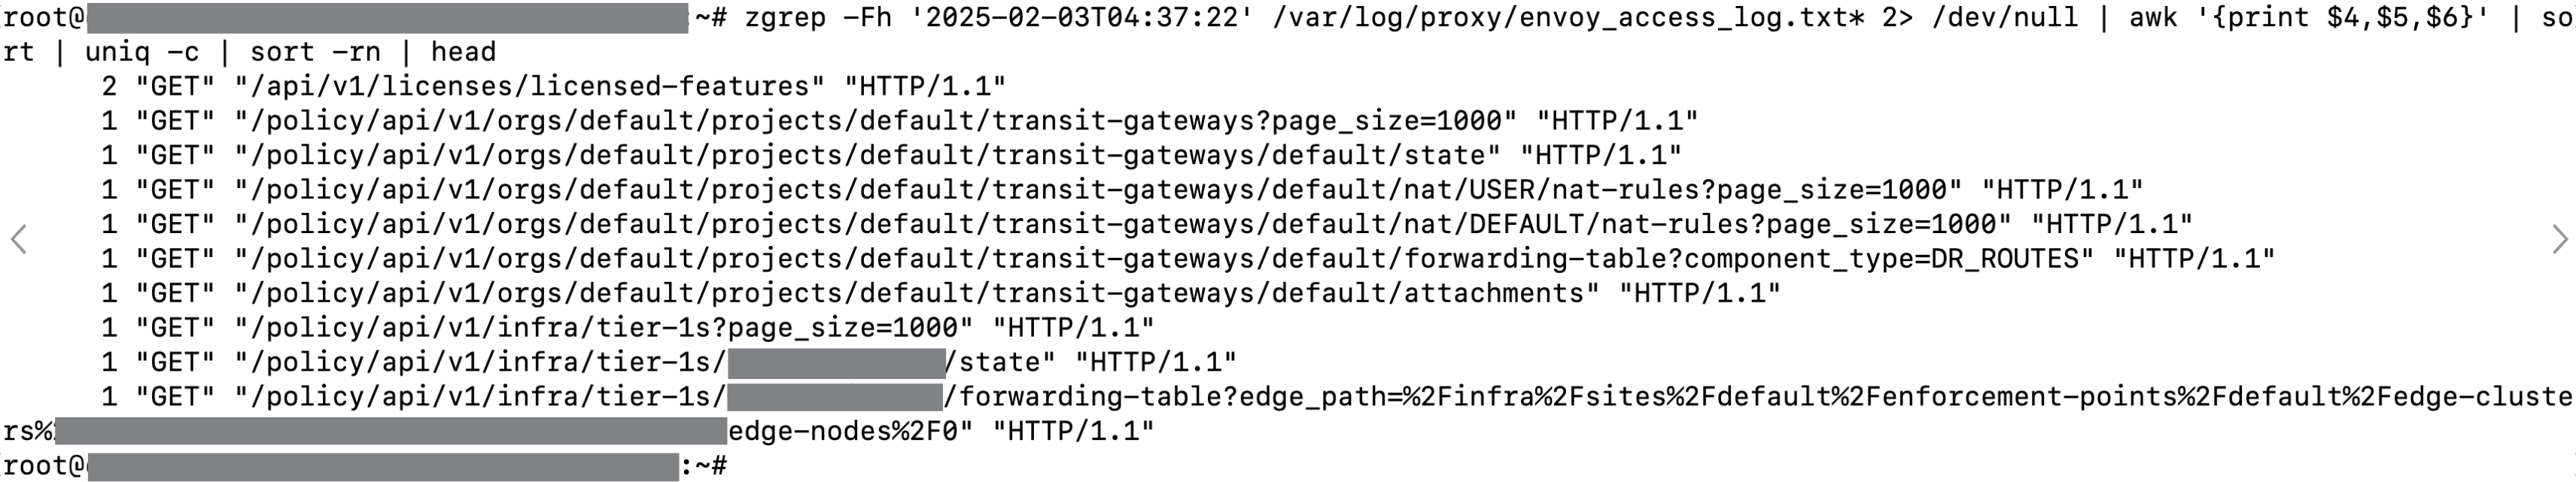
Replace <TIMESTAMP> with the desired time (e.g., 2025-02-03T04:37:22):
zgrep "<TIMESTAMP>" /var/log/proxy/envoy_access_log.txt* | awk '{print $2}' | sort | uniq -c | sort -rn[Top API Calls at Specific Timestamp]
zgrep -Fh '<TIMESTAMP>' /var/log/proxy/envoy_access_log.txt* 2> /dev/null | awk '{print $4,$5,$6}' | sort | uniq -c | sort -rn | head
Recommendation
After identifying the high-frequency API requesters and endpoints, consult with the application owners to verify the necessity of these calls. Disable or throttle unnecessary API calls to prevent performance degradation on the NSX Manager.
Additional Information
Feedback
