NSX-T Edge Transport Nodes - The Edge CPU has reached ##% which is at or above the high threshold value of 60%
Article ID: 324391
Updated On:
Products
VMware NSX
Issue/Introduction
- Edge transport nodes are reporting high CPU usage.
- Alarms similar to the below are raised in the NSX-T UI Alarm section:
The CPU usage on Edge node <UUID> has reached ##% which is at or above the high threshold value of 60%. - In the NSX-T UI, navigate to System-> Fabric -> Nodes -> Edge Transport Nodes. Select the impacted Edge TN and go to Monitor:
Services CPU is reported high CPU (between 50 and 70% - Alarms are triggered from 60%).
- In the same page, confirm Datapath CPU is fine (Under 50%).
- Confirm the High CPU Usage is due to the QoS process:
- Access the Edge in root mode and identifiy the datapathd PID: ps -aux | grep "datapathd".
- Run the command "
top -H -p <Datapathd PID>"
You will see output similar to the following:
top - 12:02:23 up 18 days, 22:55,  1 user,  load average: 3.09, 3.52, 3.05
Threads:  34 total,   3 running,  31 sleeping,   0 stopped,   0 zombie
%Cpu(s): 14.3 us,  7.5 sy,  0.0 ni, 78.2 id,  0.0 wa,  0.0 hi,  0.0 si,  0.0 st
KiB Mem :  7962892 total,   107536 free,  3884320 used,  3971036 buff/cache
KiB Swap:        0 total,        0 free,        0 used.  3961740 avail Mem

  PID USER      PR  NI    VIRT    RES    SHR S %CPU %MEM     TIME+ COMMAND
 2936 root      20   0 32.724g  51932  20116 R 91.2  0.7   4:45.58 qos14
 2807 root      20   0 32.724g  51932  20116 S  5.8  0.7   3132:44 dp-fp:0
 2905 root      20   0 32.724g  51932  20116 S  5.8  0.7   3251:53 dp-fp:1
 2916 root      20   0 32.724g  51932  20116 R  3.9  0.7 166:07.93 dp-bfd-mon4
- The Tier-1 router QOS has been enabled. This can be confirmed by looking into the /var/log/syslog of the impacted Edge:
<182>1 2020-10-27T11:46:28.318950+00:00 edge02.example.com NSX 2814 FABRIC [nsx@6876 comp="nsx-edge" subcomp="datapathd.dpc_pb(dp-ipc15)" level="INFO"] QoS enabled on lrouter a21f20eb-####-####-####-5dfd7b0d8f35, dir: 1, committed_bw: 1, burst_size: 1 <182>1 2020-10-27T11:49:48.024808+00:00 edge02.example.com NSX 2814 FABRIC [nsx@6876 comp="nsx-edge" subcomp="datapathd.dpc_pb(dp-ipc15)" level="INFO"] QoS enabled on lrouter 54f67152-####-####-####-5e9773b58c3a, dir: 1, committed_bw: 1, burst_size: 1 - Then the same feature was disabled (Same file: /var/log/syslog of the impacted Edge):
<182>1 2020-10-27T11:56:22.440196+00:00 edge01.example.com NSX 2807 FABRIC [nsx@6876 comp="nsx-edge" subcomp="datapathd.dpc_pb(dp-ipc12)" level="INFO"] QoS disabled on lrouter a21f20eb-####-####-####-5dfd7b0d8f35, dir: 1
<182>1 2020-10-27T11:56:45.423255+00:00 edge01.exampe.com NSX 2807 FABRIC [nsx@6876 comp="nsx-edge" subcomp="datapathd.dpc_pb(dp-ipc12)" level="INFO"] QoS disabled on lrouter 54f67152-####-####-####-5e9773b58c3a, dir: 1
Environment
VMware NSX-T Data Center
Resolution
This issue is resolved in VMware NSX-T 3.1.2.0 and 3.2.0, available at Broadcom downloads.
If you are having difficulty finding and downloading software, please review the Download Broadcom products and software KB.
Workaround:
There are two possible workarounds:
If you intend to use Tier-1 router Ingress QoS, enable it on the Tier-1 and the issue will disappear.
If you don't intend to use Tier-1 router Ingress QoS, once disabled. Restart the dataplane service on the impacted Edge transport node: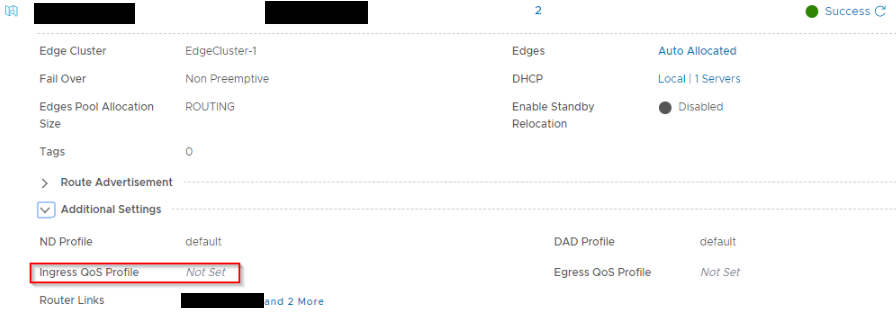
There are two possible workarounds:
If you intend to use Tier-1 router Ingress QoS, enable it on the Tier-1 and the issue will disappear.
If you don't intend to use Tier-1 router Ingress QoS, once disabled. Restart the dataplane service on the impacted Edge transport node:
- Access the Edge in SSH as admin.
- Run the CLI command to restart the dataplane service: "
restart service dataplane".
- Navigate to Networking -> Tier-1 Gateways
- Expand the T1 router configuration and expand Additional Settings.
Feedback
Yes
No
Powered by
