Slack Webhook Integration with Tanzu App Metrics
Article ID: 298373
Updated On:
Products
Issue/Introduction
Setup Slack Webhook to Receive alerts from Apps.
Resolution
Preparation: Slack Webhook Integration Setup
1- In Slack, from the workspace drop-down menu in the top left corner, navigate to Customize Workspace_Name. The Customize Your Workspace page opens in your browser.
2- Click Configure apps from the menu on the left:
3- On the App Directory page, click Custom Integrations.
4- Search for and select Incoming WebHooks.
5- From the Post to Channel drop-down menu, select the Slack channel where your incoming webhook will post messages to, and click the Add Incoming WebHooks integration button:
6- On the Edit configuration page, scroll down to the Integration Settings section and customize the incoming webhook.
7- Under the Webhook URL text box, click Copy URL.
8- Click Save Settings.
Creating a Monitor Document for the Default Indicator
-
The indicator name can correspond to one of your custom indicators or to one of the default indicator names:
RequestCount, HttpLatency, ErrorCount, CPU, MemoryPercentage, and DiskPercentage.
Step-1: Create a monitor document
Below is a sample monitor document:
---
product: pikachu,pikachu,spring-music

webhook_url: https://hooks.slack.com/services/####/######/#######

monitors:
  - name: High HTTP requests
    indicator: RequestCount
    warning:
      operator: ge
      threshold: 6.0
      duration: 10s
      only_every: 2m
    critical:
      operator: gte
      threshold: 10.0
      duration: 10s
      only_every: 2m
  - name: High HTTP latency
    indicator: HttpLatency
    warning:
      operator: ge
      threshold: 8.0
      duration: 10s
      only_every: 2m
    critical:
      operator: gte
      threshold: 10.0
      duration: 10s
      only_every: 2m
Step-2: cURL the Monitor Document to App Metrics
$ curl -vvv https://metrics.FQDN/monitor-documents -H "Authorization: $(cf oauth-token)" --data-binary "@http_monitors.yml" -k
Step-3: Confirm the monitors have been set succefully on App Metrics UI
Step-4: Test and confirm the alerts are well received by Slack channel
# The alert messages copied from Slack Channel

[WARNING] High HTTP latency violated threshold
    App: pikachu,pikachu,spring-music
    Indicator: HttpLatency
    Since: 2022-10-14T06:06:40.895Z
    Current value: 8.940551941176894
    Details: metrics.FQDN/apps/######-####-####-####-##########

[CRITICAL] High HTTP latency violated threshold
    App: pikachu,pikachu,spring-music
    Indicator: HttpLatency
    Since: 2022-10-14T06:06:40.895Z
    Current value: 10.30439894117642
    Details: metrics.FQDN/apps/######-####-####-####-##########
Creating a Monitor Document for the Non-Default Indicator
Step-1: Create a indicator document
---
apiVersion: indicatorprotocol.io/v1
kind: IndicatorDocument

metadata:
  labels:
    deployment: "Error-404-Count"

spec:
  product:
    name: pikachu,pikachu,spring-music
    version: 0.0.1

  indicators:
    - name: "NewErrorTest"
      promql: "sum((rate(http_total{source_id='$sourceIdc',status_code='404'}[60s:15s])) * 60) by (process_type)"
      documentation:
        title: "Error-404-Counts"
      presentation:
        units: "counts"
Step-2: cURL the Indicator Document to App Metrics
$ curl -vvv https://metrics.FQDN/indicator-documents -H "Authorization: $(cf oauth-token)" --data-binary "@NewErrorTest.yml" -k
Step-3: Confirm the New-Indicator Chart is Showing on the App Metrics
Step-4: Create a Monitor Document and cURL the Document to App Metrics
$ curl -vvv https://metrics.FQDN/monitor-documents -H "Authorization: $(cf oauth-token)" --data-binary "@http_monitors.yml" -k
Step-5: Confirm the monitors have been set successfully on App Metrics UI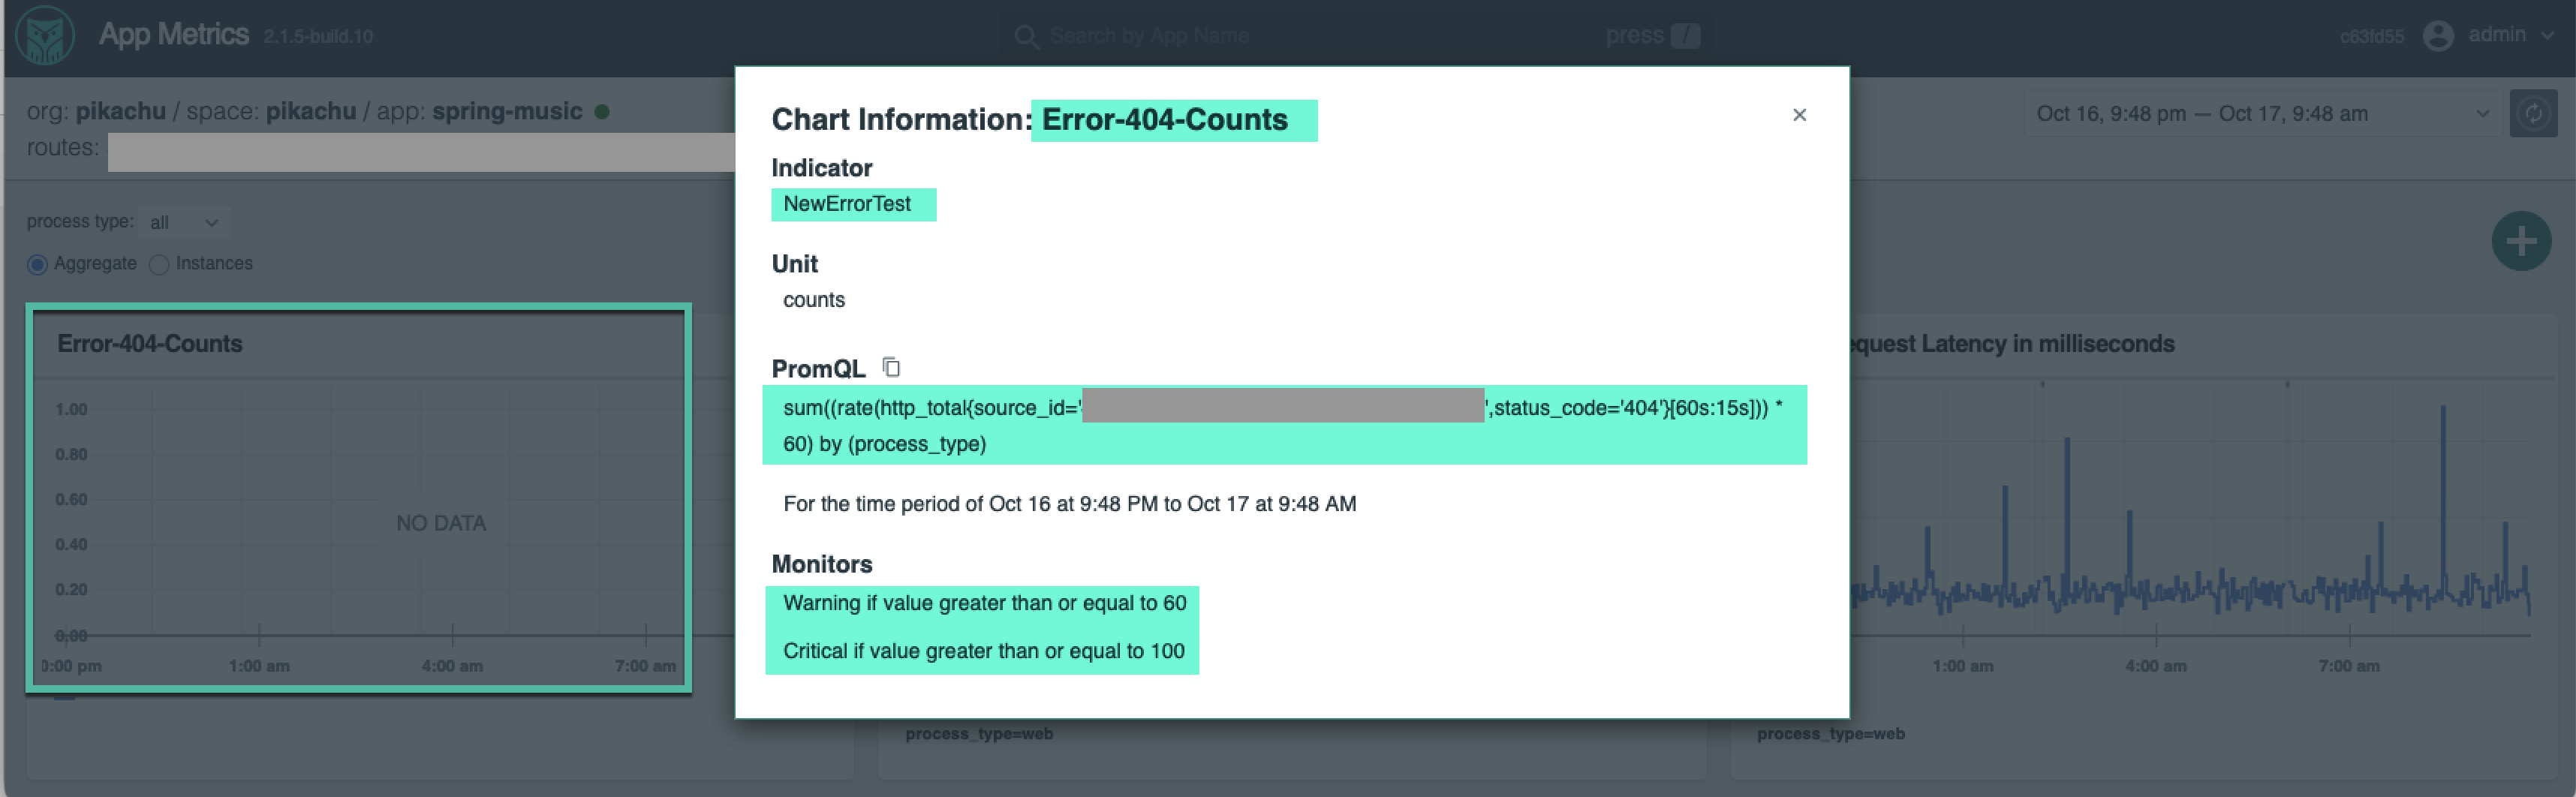
Feedback
