If prometheus scrape_interval is set to 1m, some metrics (e.g. SyslogAgent_LossRate_1M) will not return data in Grafana UI
Article ID: 298366
Updated On:
Products
VMware Tanzu Application Service for VMs
Issue/Introduction
In the Prometheus pane of a Healthwatch for VMware Tanzu tile, scrape_interval specifies the frequency at which you want the Prometheus instance to scrape Prometheus exposition endpoints for metrics and its default value is 15s.
Some customer may increase this default value to 1m or larger with the consideration of saving more storage, which leads to the failure of retrieving data for some metrics in Grafana UI.
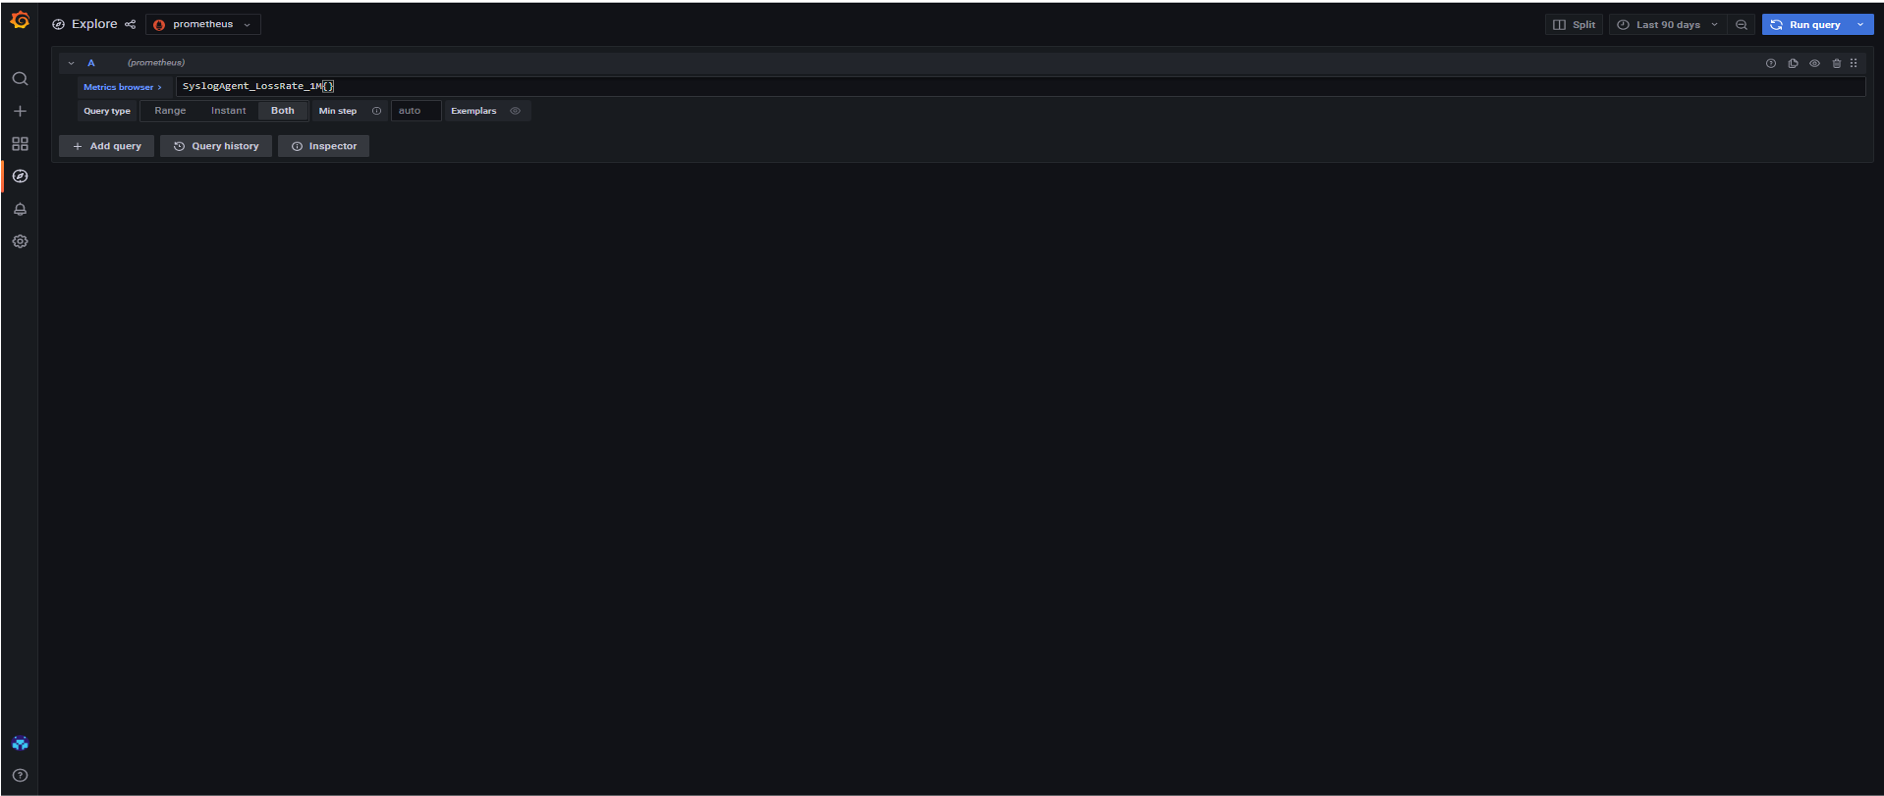
For instance, SyslogAgent_LossRate_1M (sum(rate(dropped{origin="loggregator.syslog_agent", direction="egress"}[1m])) / sum(rate(ingress{origin="loggregator.syslog_agent", scope="all_drains"}[1m]))) is a super value metric to measure the Syslog Agent loss rate over a one-minute period. If scrape_interval is increased to 1m or lager, no data will be returned by querying the metrics in the Grafana UI like below:
The root cause is that if the scrape_interval is set to 1 minute, then Prometheus will only collect 1 point per minute for each time series. However, when Prometheus is calculating rates, it needs 2 points within the timeframe in order to be able to calculate it.
So in this case, to make 2 or more points available for Prometheus to do the rates calculation and return the UI data, the metrics will need to be queried over a lager time frame, say 2 minutes or 5 minutes: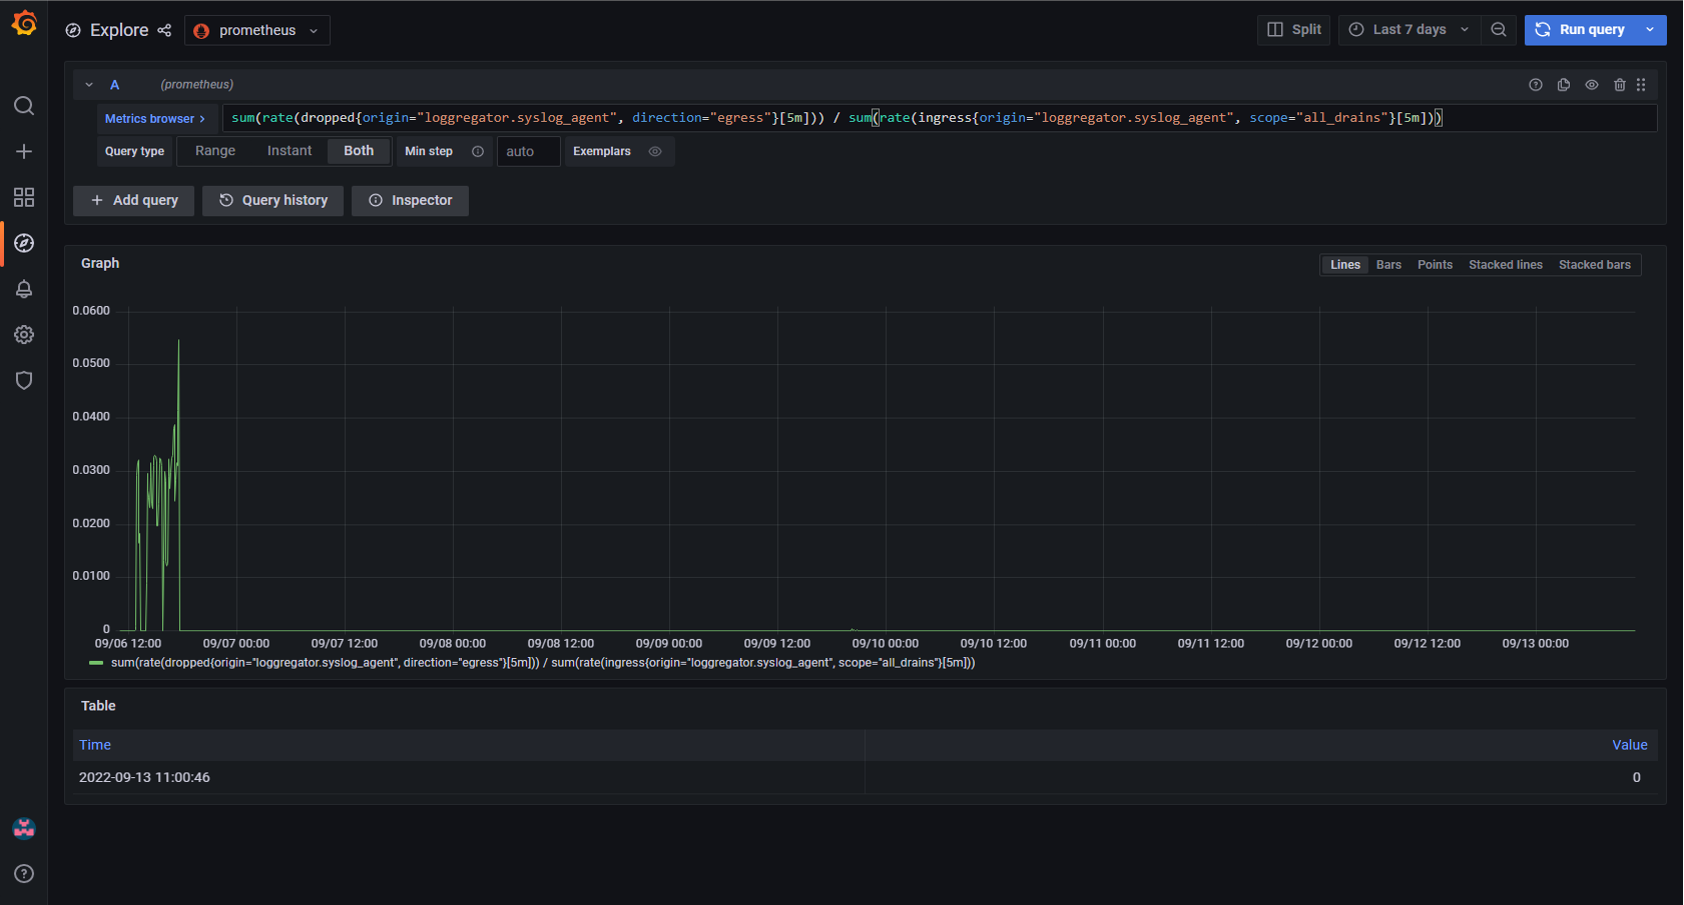
Some customer may increase this default value to 1m or larger with the consideration of saving more storage, which leads to the failure of retrieving data for some metrics in Grafana UI.
For instance, SyslogAgent_LossRate_1M (sum(rate(dropped{origin="loggregator.syslog_agent", direction="egress"}[1m])) / sum(rate(ingress{origin="loggregator.syslog_agent", scope="all_drains"}[1m]))) is a super value metric to measure the Syslog Agent loss rate over a one-minute period. If scrape_interval is increased to 1m or lager, no data will be returned by querying the metrics in the Grafana UI like below:
The root cause is that if the scrape_interval is set to 1 minute, then Prometheus will only collect 1 point per minute for each time series. However, when Prometheus is calculating rates, it needs 2 points within the timeframe in order to be able to calculate it.
So in this case, to make 2 or more points available for Prometheus to do the rates calculation and return the UI data, the metrics will need to be queried over a lager time frame, say 2 minutes or 5 minutes:
Environment
Product Version: 2.11
Resolution
Either decrease the scrape_interval value or query the metrics over a larger time frame so that the Prometheus can have 2 or more points to calculate the rates.
Feedback
Yes
No
Powered by
