GemFire: Heap Spikes and Subsides quickly
Article ID: 294469
Updated On:
Products
VMware Tanzu Gemfire
Issue/Introduction
This article describes a phenomena related to heap behavior found in some GemFire environments where heap needs to be tuned. Specifically, if you have insufficient heap or a bad heap configuration, you may experience or observe major spikes in heap only to see that heap consumption immediately subsides again.
Below are a few VSD charts that illustrate the behavior:
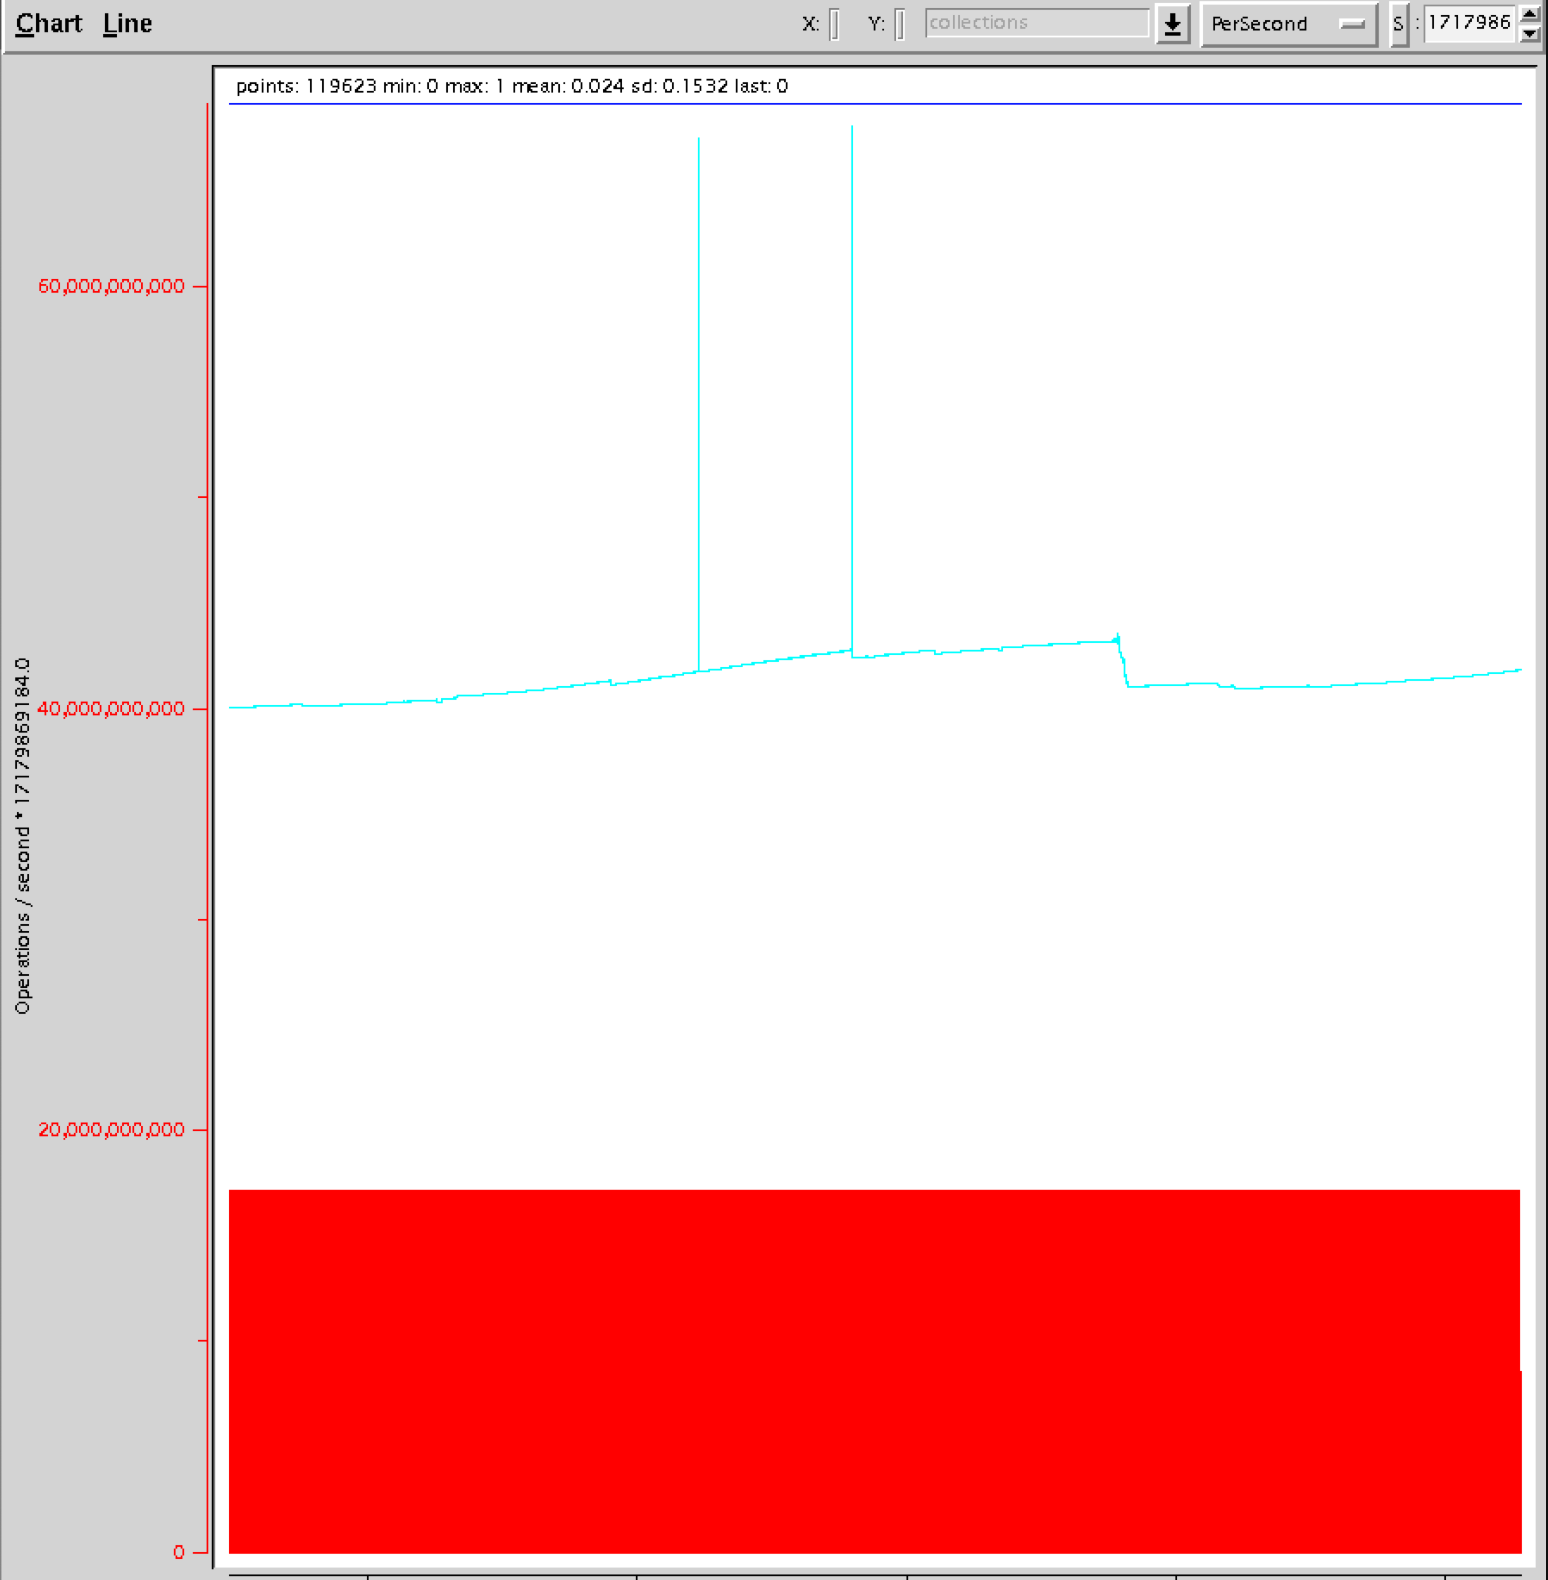
Looking at the chart, you can see the max heap line at the top and then the tenured used heap line with the 2 "false" spikes that immediately subside. This is not driven by actual usage or a garbage collection.
It is actually a bad heap reading. The usage is inaccurate. In every case where this behavior has been observed, it has been driven by very frequent, if not constant CMS collections due to an inadequate setting for the CMSInitatingOccupancyFraction (OFraction). The constant CMS collections are shown as the solid red line of operations.
This could be due to an increased heap footprint without increasing the heap appropriately. Perhaps more data is now being stored in the heap and you have surpassed what used to be an adequate OFraction. Perhaps you've upgraded, and heap consumption is now higher due to the newer versions of GemFire, Linux, whatever the case may be.
You may not even observe the behavior but if you are using the ResourceManager, with eviction and/or critical thresholds, your system could very well be negatively impacted due to unnecessarily evicting data, or worse, putting the system into an above critical alert behavior. This issue needs to be avoided at all costs.
If you see unexpected log messages indicating you are above the eviction threshold, or above the critical threshold, or receive alerts related to heap being at those levels briefly, you are potentially being impacted by this issue and need to take action to research the cause of those messages.
Below are a few VSD charts that illustrate the behavior:
Looking at the chart, you can see the max heap line at the top and then the tenured used heap line with the 2 "false" spikes that immediately subside. This is not driven by actual usage or a garbage collection.
It is actually a bad heap reading. The usage is inaccurate. In every case where this behavior has been observed, it has been driven by very frequent, if not constant CMS collections due to an inadequate setting for the CMSInitatingOccupancyFraction (OFraction). The constant CMS collections are shown as the solid red line of operations.
This could be due to an increased heap footprint without increasing the heap appropriately. Perhaps more data is now being stored in the heap and you have surpassed what used to be an adequate OFraction. Perhaps you've upgraded, and heap consumption is now higher due to the newer versions of GemFire, Linux, whatever the case may be.
You may not even observe the behavior but if you are using the ResourceManager, with eviction and/or critical thresholds, your system could very well be negatively impacted due to unnecessarily evicting data, or worse, putting the system into an above critical alert behavior. This issue needs to be avoided at all costs.
If you see unexpected log messages indicating you are above the eviction threshold, or above the critical threshold, or receive alerts related to heap being at those levels briefly, you are potentially being impacted by this issue and need to take action to research the cause of those messages.
Environment
Product Version: 9.10
OS: Linux
OS: Linux
Resolution
It is easy to resolve this issue with any one of a few tuning changes.
If you get a 2nd such reading in a row, then GemFire will act appropriately and alert you accordingly, evicting data if configured to do so and putting the distributed system in above critical behavior, etc.
If you set the flag even higher, to 3 for example, GemFire would essentially ignore the first 3 consecutive bad heap readings coming from the JVM and only act on the 4th such consecutive reading. That said, we do not recommend setting it above 1.
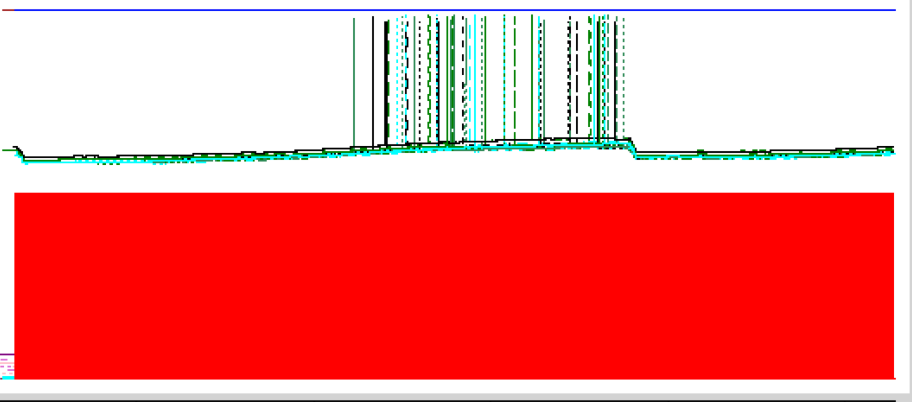
In all cases where this behavior has been observed, we have only seen 1 bad consecutive reading and then the reading is again accurate. As you can see from some of the charts shared, if the constant CMS collections continue, you are likely to experience multiple false spikes over time.
- Increase your total heap, Xms and Xmx, such that your heap consumption percentage decreases below the OFraction value.
- Increase your OFraction to a percentage that takes you above the maximum real usage.
- As an additional protection mechanism, we recommend you set the following system property to 1 in your environment: gemfire.memoryEventTolerance=1
If you get a 2nd such reading in a row, then GemFire will act appropriately and alert you accordingly, evicting data if configured to do so and putting the distributed system in above critical behavior, etc.
If you set the flag even higher, to 3 for example, GemFire would essentially ignore the first 3 consecutive bad heap readings coming from the JVM and only act on the 4th such consecutive reading. That said, we do not recommend setting it above 1.
In all cases where this behavior has been observed, we have only seen 1 bad consecutive reading and then the reading is again accurate. As you can see from some of the charts shared, if the constant CMS collections continue, you are likely to experience multiple false spikes over time.
Feedback
Yes
No
Powered by
