Some default graphs and charts for UAA of Tanzu Application Service are displayed with "No data" in Grafana UI
Article ID: 293868
Updated On:
Products
Operations Manager
Issue/Introduction
The following deafult graphs and charts for UAA of Tanzu Application Service may be displayed with "No Data" in Grafana UI as a component of Healthwatch v2 product.
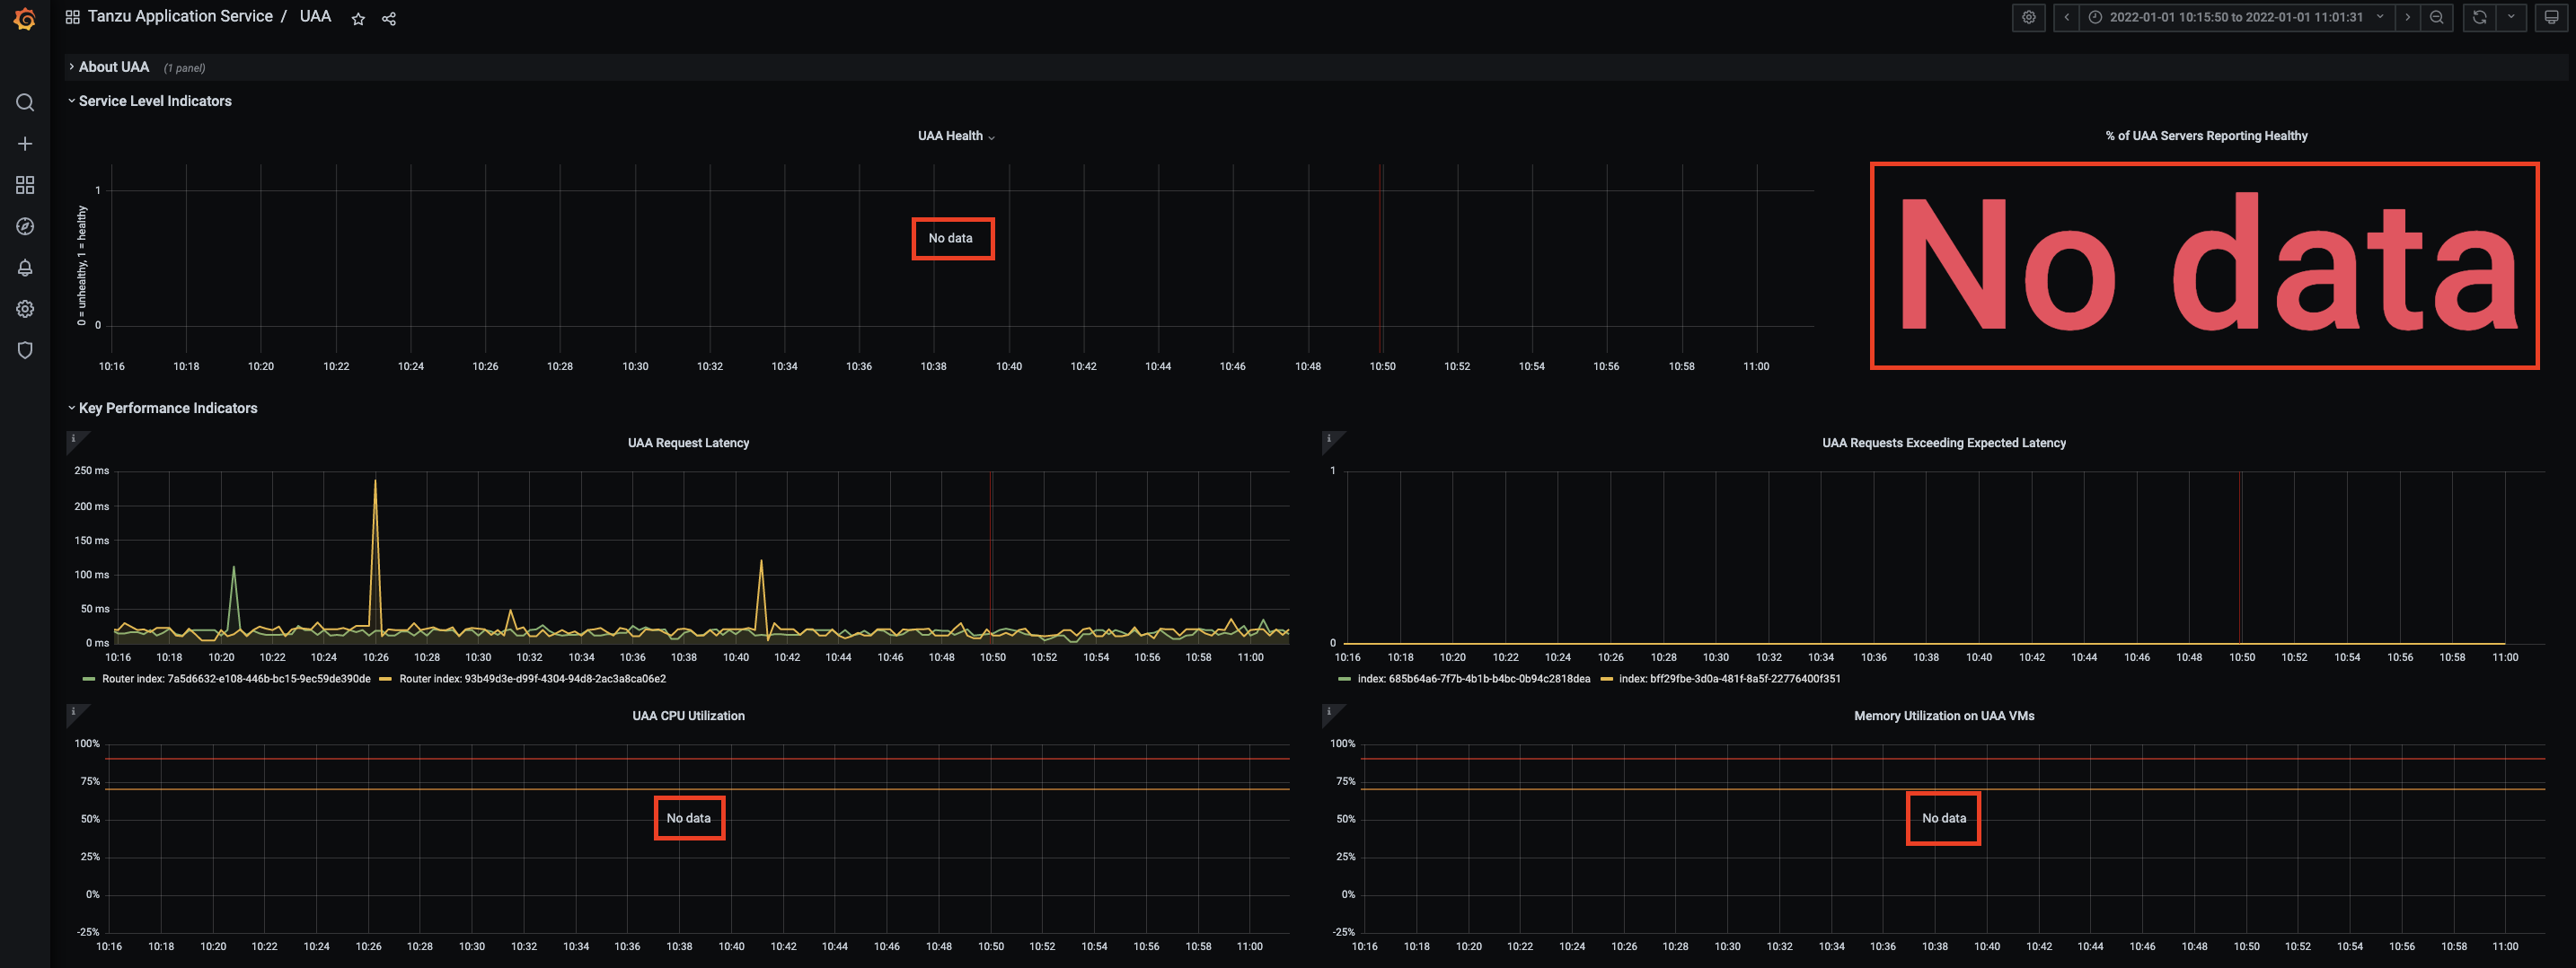
- UAA Health
- % of UAA Servers Reporting Healthy
- UAA CPU Utilization
- Memory Utilization on UAA VMs
Environment
Product Version: Other
Resolution
In this particular case, you may have removed a check symbol from the following configuration of BOSH Director tile on Ops Manager UI to disable additional System Metrics.
To display those UAA related graphs and charts as expected rather than just with "No data", you need to add a check symbol with the above configuration, save the modification and perform Apply Changes with BOSH Director tile on Ops Manager UI.
- Director Config -> Enable additional System Metrics
- UAA Health
- % of UAA Servers Reporting Healthy
- UAA CPU Utilization
- Memory Utilization on UAA VMs
To display those UAA related graphs and charts as expected rather than just with "No data", you need to add a check symbol with the above configuration, save the modification and perform Apply Changes with BOSH Director tile on Ops Manager UI.
Feedback
Yes
No
Powered by
