CB LiveQuery: What Do The Columns In The Device View Mean?
Article ID: 286891
Updated On:
Products
Carbon Black Cloud Audit and Remediation (formerly Cb Live Ops)
Issue/Introduction
When using the LiveQuery feature, what do the columns in the Device View mean?
Environment
- CB Defense Sensor: 3.3.x And Higher
- CB Defense Web Console: All Versions
- Microsoft Windows: All Supported Versions
- Mac OSX: All Supported Versions
- LiveQuery Feature Enabled
Resolution
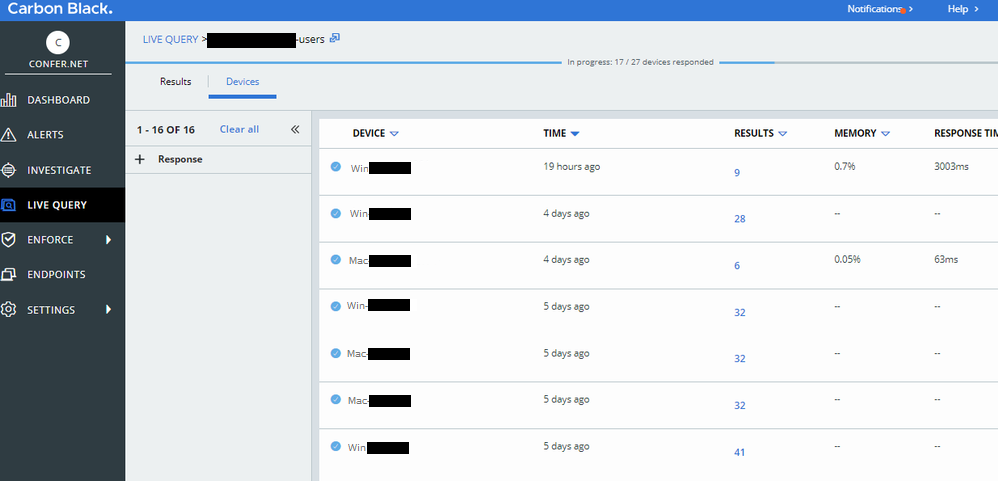
The table below contains the column definitions, here is a screenshot of the device view from within the console for reference:

| Column | Definition |
| Device | The name of the endpoint that responded to the query |
| Time | Timestamp for when the query returned to the Carbon Black console |
| Results | The number of results which matched the query question |
| Memory | The maximum amount of memory the query used on the device during query runtime |
| Response Time | The amount of time it took to run the query on the device |
| CPU Usage | The average amount of CPU the query used on the device during query runtime. This is also an average over all CPUs when multiple cores are present. |
Additional Information
- Our new Device View inside the query results page reveals data regarding the impact of running the query on the selected devices. We are surfacing this data so you and your team can use the information to craft your queries appropriately.
- Please keep in mind the Memory and CPU stats are peak usage, and that if the CPU, or individual cores, are idle during the query then it can spike to near 100%.
- If the Response Time is more than five minutes, it is recommended that the query should be rewritten, or run during a time frame when the device will not be negatively impacted.
Feedback
Yes
No
