Dynamic context for Trend Projection views
Article ID: 212929
Updated On:
Products
CA Performance Management
Network Observability
Issue/Introduction
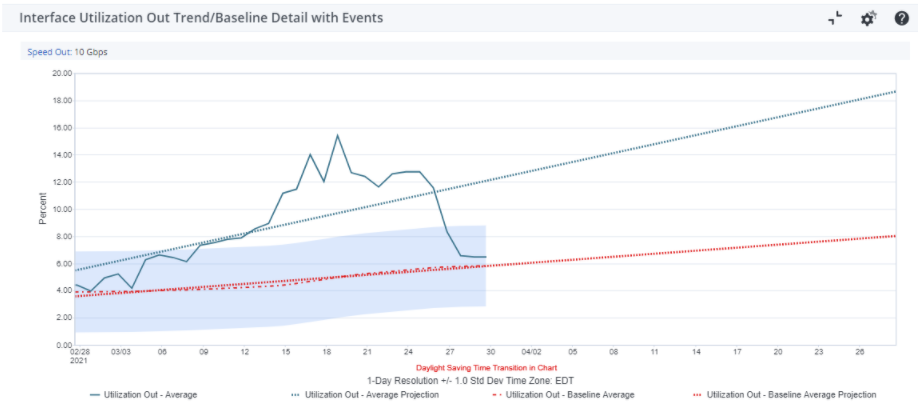
For capacity planning purpose, customer wants to generate views with Trend Projections for 30 to 90 days. In PM there is the following view available:
Is it possible to get a dynamic context for this type of View, and sort the interfaces by descending baseline projection order?
Is it possible to get the total Interface Utilization instead of Utilization In and Utilization Out?
Is it possible to generate a Threshold if the trend projection exceeds a fixed value in e.g. 30 days?
Environment
All supported DX NetOps Portal web server releases
Resolution
We can obtain a View like this:
 Select the Utilization metrics (both average and baseline).
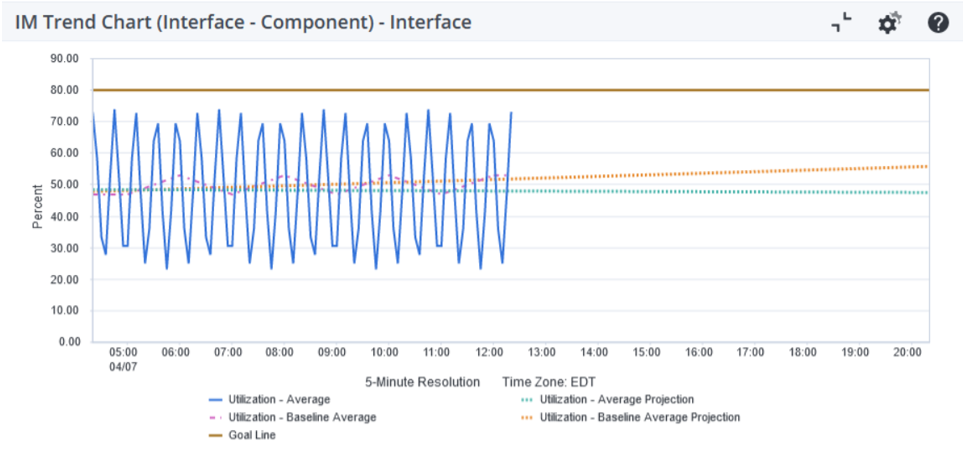
For capacity planning the Score Card Trend is typically used. That can be very useful for 30 to 90 days projections.
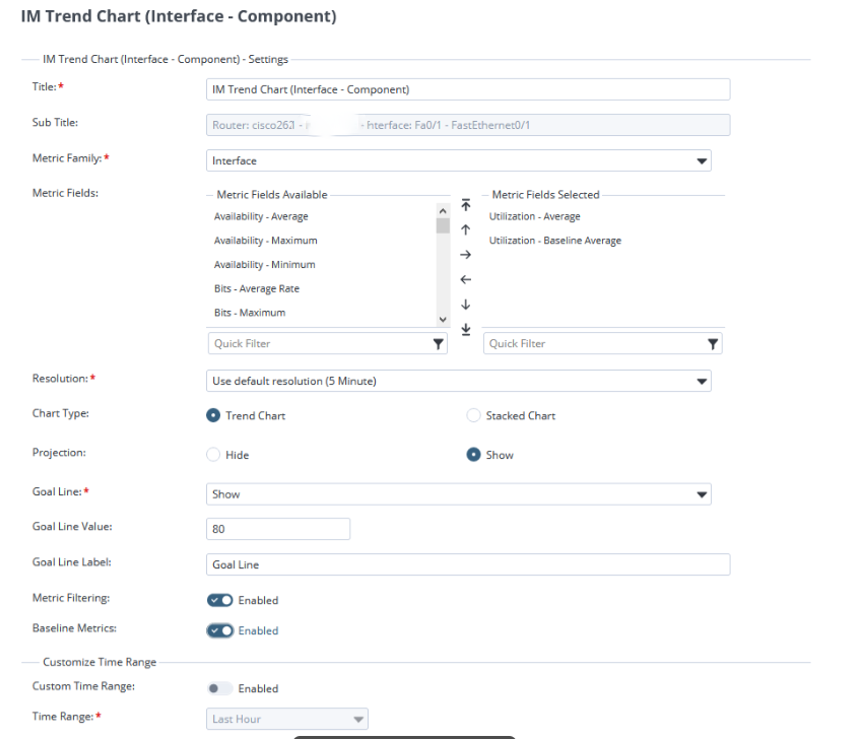
Use the custom view that is available on the dashboard builder when customizing the Interface context tab:
Then select the option to Projection and then set a Goal Line as the threshold, as shown above.
For capacity planning the Score Card Trend is typically used. That can be very useful for 30 to 90 days projections.
It would be done within the perspective of a parent group, but can be profiled at the component level (in this case Interface). However, it may only plot for one metric, but could be done with a two Views dashboard, with one for utilization core and baseline.
Feedback
Yes
No
Powered by
