Measuring network performance between the Notification Server and a remote SQL server?
Article ID: 180586
Updated On:
Products
Issue/Introduction
How can I measure network performance between the Notification Server and a remote SQL server? How does the SQL Ping tool work?
Resolution
The SQL ping tool (current version is 1.4) has been created to measure the response time for a SQL query from the NS to a remote SQL server. High network latency is a known cause of poor NS performance. The tool can also be used from other computers with .NET 1.1 installed, such as Deployment Servers or Recovery Servers.
How it works
The tool will first create a temporary table with 64kb of data on the target SQL server. It will then retrieve the contents of the temporary table on a fixed interval. By measuring the round trip time, an evaluation of the network communications between the NS host and the SQL server can be accomplished. This pure read operation test is designed to incur zero CPU load on the SQL server (which can be proven with a SQL Profiler trace).
In a pristine environment, response times would be between 0 and 15 milliseconds (ms). There would be zero network failures. A congested network can cause delays in forwarding packets between the servers, including re-sending of the same request.
Setup
- Copy the attached executable to the NS, and open it. Note: For running on Windows 2008, first right click on the program icon and then choose Run as Administrator, otherwise the program will fail to run.
- The NS database settings will be read from the registry.
- If indicated, enter the SQL password
- Click the Ping button
- By default, the tool will create a 64kb row in a temporary table, and request the data every 3 seconds.
- Click the Stop button to calculate the average response time.
Sample Execution:
The boxes at the top keep a running count of response times.
- Good is less than 100ms
- Warning is between 100ms and 400ms
- Bad is greater than 400ms
- Failures are counted when a network communication problem is encountered
File logging
- Check the Enable Logging box.
- If desired, modify the specified filename and path.
- Start the ping trace as normal.
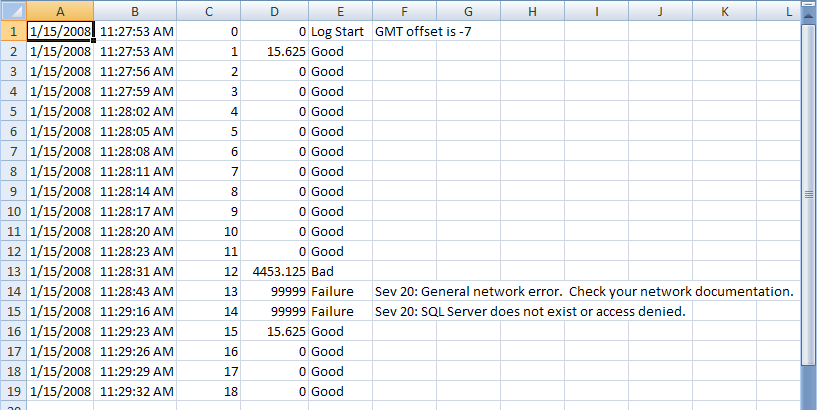
- The logging is output in tab-delimited format. It can be viewed with notepad or Excel.
Note: For each error, the first 100 characters of the error message are included in the last column.
Sample log file viewed in Excel

Performance Monitor counter
- Open Perfmon.msc > Performance Logs and Alerts > Right click > New Log Settings
- Name the log "SQL Ping"
- Click Add Objects > SQL Ping > Add > Close
Note: The SQL Ping perfmon counters will only exist if the SQL Ping tool is running
- Click OK (The default interval of every 15 seconds is appropriate)
- Verify that the new counter log is now running (it should be green)
- After a few hours, stop the counter log, and analyze them for obvious performance issues. (C:\Perflogs\sql_ping_00000*.blg)
Version History
v 1.4
- Added file logging functionality
v 1.33- Added detection for additional types of SQL connection failures
- Added Date and Time information for each ping attempt
- Added alignment and formatting of ping number and ping length
- Added asterisks indicator to bad & failed ping attempts
- Added textbox to display the running ping average. For reference, network failures are counted as ~100 seconds.
- Added display filters to pause and show the last 64k of all ping attempts or just the bad/failed ping attempts.
- Disabled usage of SQL pooled connections
- This was implemented to avoid a known bug in .NET 1.1 ADO, which fails to recover from a dead SQL pool after network connectivity is restored. NS6 appears to suffer from this bug, but it would be very expensive to disable connection pooling for the NS web and Altiris service.
- Set counter fields to read-only
- Set interval box to read-only during ping operations
- Fixed issue where it was difficult to stop pinging during network failures
- Improved thread safety
- Other minor UI improvements
v 1.21
- Fixed flaw in milliseconds measurement
